I’ve experimented with making longbows with four different riser layouts. Riser A represents probably the…
How to make and read a force/draw curve (part 3)
How to READ a force/draw curve
Welcome to part three of the series! In part one, we learned how to build a bow weighing rack and measure the draw weights of our bow at each one inch increment of the draw. We recorded the data on a note pad and saved it for part two. Then, in part two, we entered the data into a table in the spreadsheet template that I created for Microsoft Excel, and watched Excel automatically create a line graph showing the force/draw curve and calculate some values about stored energy and efficiency. Now, in part three, we will read the force draw curve, the values created in the table, and interpret what they tell us about the bow. This is the best part of the series!
What is a force/draw curve chart or graph?
I think that a force draw curve can either be a simple line chart or a scatter plot, depending on the accuracy of the draw force readings taken when we measured the bow. 🙂 In either case, the graph generated gives a graphical representation of the data we collected from the bow. It can show us trends that are hard to see by looking at the data in the table. I’m sure that the draw force readings I recorded were not super accurate so what I have created is probably best considered a scatter plot. So what is a “scatter plot”?
Check out the following quote defining a scatter plot. Click here to read the entire “Scatter plot” at Wikipedia article.
“A scatter plot or scattergraph is a type of mathematical diagram using Cartesian coordinates to display values for two variables for a set of data. The data is displayed as a collection of points, each having the value of one variable determining the position on the horizontal axis and the value of the other variable determining the position on the vertical axis. This kind of plot is also called a scatter chart, scattergram, scatter diagram or scatter graph. A scatter plot is used when a variable exists that is under the control of the experimenter. If a parameter exists that is systematically incremented and/or decremented by the other, it is called the control parameter or independent variable and is customarily plotted along the horizontal axis. The measured or dependent variable is customarily plotted along the vertical axis. A line of best fit (alternatively called ‘trendline’) can be drawn in order to study the correlation between the variables. An equation for the correlation between the variables can be determined by established best-fit procedures. For a linear correlation, the best-fit procedure is known as linear regression and is guaranteed to generate a correct solution in a finite time.”
A scatter plot describes exactly what we have created. In our force draw curve graph, the independent variable (plotted along the horizontal axis) is the draw length in inches. As mentioned in the quote, this variable is under our control. It increased at a fixed rate of one inch at a time as we drew the bow. The dependent variable (plotted along the vertical axis) is the draw force of the bow in pounds (lbs). This variable is not under our control. It changed over the entire draw length as we draw the bow from brace height to full draw.
If I had been able to more precisely measure the draw force exactly at each one inch increment of the draw, then I could have simply connected the points, which would have resulted in a line connecting the dots that was a smooth curve. However, my draw weight readings were slightly inaccurate, not taken at exactly one inch increments or exactly read from the bow scale, so the curve in the Excel spreadsheet has been set to automatically smooth out the curve and draw a “best fit” line. As mentioned in the Wiki quote, this is called a “regression” line, but that is a lesson for a different day.
A force draw curve shows energy storage
The most important information that a force draw curve (FDC) shows is a graphical representation of how much energy is stored when the bow is drawn and where that energy is stored during the draw stroke. If you make all of your charts with the same size and scale, then you can compare the curves of different bows. It is important to make them the same size and scale so you are making an apples to apples comparison. This is why I use the same Excel spreadsheet and graph drawing template to make all of my FDC charts and graphs. Comparing the FDCs of different bows instantly shows how the bows compare.
Although you could try reading a FDC graph to see how much draw force a bow stores at a certain inch of the draw, I find it much easier to simply look at the data in the table. Instead, I prefer using a FDC graph to see draw force trends shown by the line that has been drawn and for comparing the FDC graphs of different bows.
What does a force draw curve show about stored energy?:
- A bow with the highest FDC stores the most energy.
- A FDC with a higher curve through the left portion of the graph stores more energy early in the draw.
- A FDC with a higher curve through the right portion of the graph stores more energy late in the draw.
- A FDC that has a wider middle portion of the graph stores more energy during the middle of the draw.
Obviously, this is really basic stuff, but I find it very useful information for comparing bows.
A force draw curve shows stacking
I think the second most important information (and possibly the most useful information to a bowyer) that a FDC shows is how much a bow is stacking and where stacking starts happening during the draw stroke. In the following paragraphs, I’ll explain how I use some more advanced graph reading techniques to see where stacking occurs in a bow.
What does a force draw curve show about stacking?:
- A FDC that diverges up and away from the straight reference line farther to the left stacks at a shorter draw length.
- A FDC that diverges up and away from the straight reference line farther to the right stacks at a longer draw length.
The slope and shape of the line show draw force change
The slope of the line shows the rate of draw force change
The slope of the FDC shows the rate that the draw force is changing anywhere along the FDC. When the line slopes upward, the draw force is increasing in each one inch increment of the draw, and when the line slopes downward, the draw force is decreasing in each one inch increment of the draw. The steepness of the curve up or down is the “slope” of the curve. The slope describes the rate of draw force change during the draw stroke. You could probably dig out your old high school math book and learn (again…lol) how to calculate the slope at any point along the line, but I’m not sure that would really be any more helpful than just making a visual observation about whether it is “steep” or not. Obviously, the steeper the line is in an upward direction from left to right, the harder the bow feels to draw. The steeper the line is in a downward direction from left to right, the easier the bow feels to draw. Again, this is pretty basic stuff, but incredibly useful in comparing bows.
A straight line represents a fixed rate of change
In the illustration below, the FDC is a straight line. This means that the draw force is increasing at a fixed rate…the bow is pulling at the same rate of draw force increase in each successive inch of the draw. The change in draw force per inch is the same as it was in the previous inch. This is called a “direct relationship” between draw force and draw length, because the draw force varies “directly” with draw length. It doesn’t matter if the line is sloping upward or downward, if any portion of the FDC looks like a straight line, we know that portion of the line describes a fixed rate of draw force change.

A curved line means the rate of draw force change is changing
When the FDC is curved it means that the rate of draw force change is changing. Huh? Yes, that is correct, and it is something that you might not have considered before. If we look at the shape of the curve of the line when it rises or falls, it tells us that the rate of draw force change is changing during the draw. I know this sounds confusing, but let me explain…
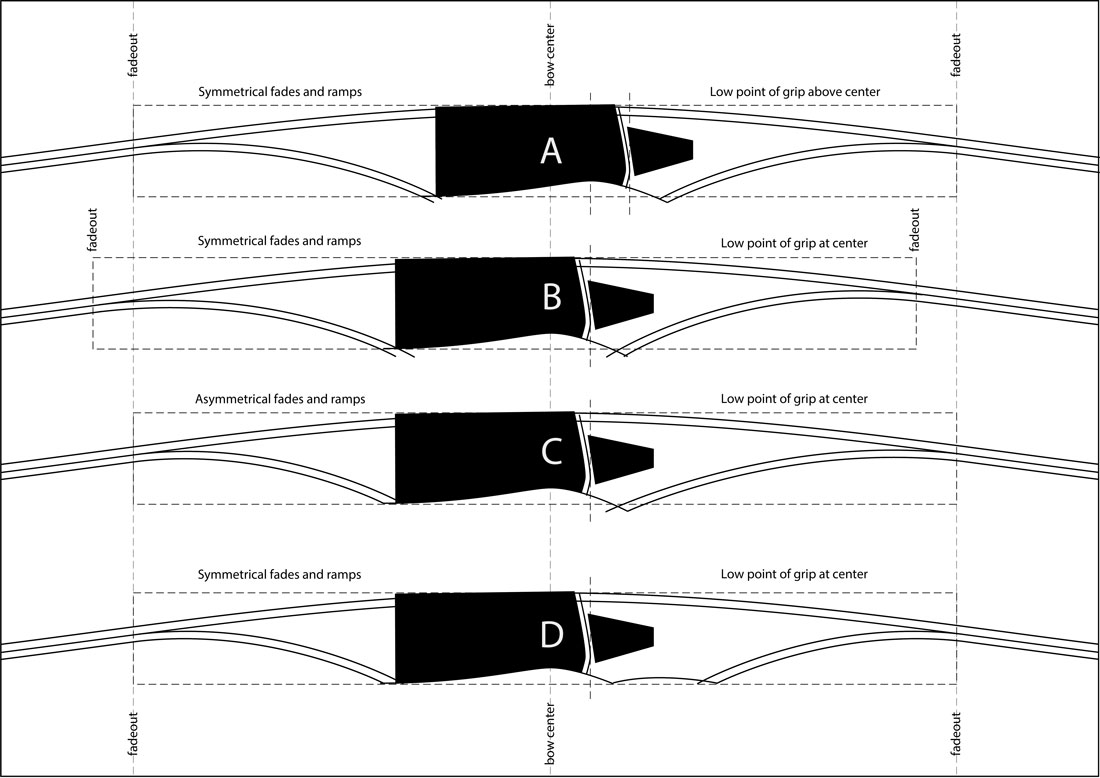
In the illustration below, the FDC is a curving line. When the the FDC is curved, it means that the draw force is increasing or decreasing at a changing rate. I’ve drawn a hypothetical curve that shows what the FDC looks like when the rate of draw force is changing in each of four different ways. Yes, this bell-shaped curve looks more like one from a compound bow instead of a traditional bow, but this shape of curve is necessary to show in one graph all of the four different ways that the rate of draw force change can change in a FDC.

Quadrant “A”: When the FDC curves upward like in quadrant “A”, the draw force is increasing at an increasing rate. This means that the bow is getting increasingly harder to pull. At any point along this segment of the curve, the draw force change per inch is more than it was in the previous inch.
Quadrant “B”: When the FDC curves upward like in quadrant “B”, the draw force is increasing at a decreasing rate. This means that the bow is getting decreasingly harder to pull (it is getting harder to pull but not as fast as it was in quadrant A). At any point along this segment of the curve, the draw force change per inch is less than it was in the previous inch.
Quadrant “C: When the FDC curves downward like in quadrant “C”, the draw force is decreasing at an increasing rate. This means that the bow is getting increasingly easier to pull. At any point along this segment of the curve, the draw force change per inch is more than it was in the previous inch.
Quadrant “D”: When the FDC curves downward like in quadrant “D”, the draw force is decreasing at a decreasing rate. This means that the bow is getting decreasingly easier to pull (it is getting easier to pull but not as fast as it was in the previous quadrant). The draw force change per inch is less than it was in the previous inch.
So, the tightness of the curve represents the rate of change. When the curve is becoming a tighter curve, it means that the rate of change is increasing. When the curve is becoming less tight of a curve, it means that the rate of change is decreasing.
Reading the curve shows where “stacking” occurs
I find this graph reading method useful in showing how much and where a bow is stacking. The illustration below shows a typical FDC of a traditional bow that stores a lot of energy and has a “valley” or “sweet spot” near the end of the draw stroke. I’ll walk us through the entire draw stroke and explain what is happening in each portion of the draw.

First look at the FDC in the lower left portion of the graph. You can see by the way the curve rises quickly up and away from brace height that the draw force is increasing rapidly in the early inches of the draw. It is steep, so we know that the draw force is increasing rapidly, but we also know from our previous lesson that the shape of the curve in this portion indicates that the draw force is increasing at a decreasing rate. This means that the draw force is getting harder, but it’s draw force change per inch less in each successive inch of the draw.
Next, look at the middle portion of the FDC. Where it arcs over and flattens or straightens out a bit, we know that the rate is still increasing at a decreasing rate, but the curve is gentler so we know that the rate of change per inch is less than it was in the early portion of the draw. At this point, the draw force is still getting harder, but it is gaining even less per inch than it was early in the draw.
Finally, look at the right portion of the FDC, where it leaves the valley and turns up and away from the straight reference line. At this point the curve is also getting tighter, so we know that the draw force is now increasing at an increasing rate. This means that the draw force is not only getting harder to pull, but it is getting increasingly harder to pull in each successive inch of the draw. The change per inch is getting increasingly larger.
The straight reference line below the FDC makes it easier to see these changes in the curve. This line represents a direct relationship between draw weight and draw length (remember that a straight line shows a fixed rate of change). When the FDC is converging towards the line or diverging away from the line, it is easier to see changes in the FDC. The bow starts “stacking” where the FDC starts rising up and away from the straight reference line. See how easily it is to see by comparing to the straight line? The thing to remember is that stacking occurs when the draw force starts “increasing at an increasing rate.”
A FDC tells us things about a bow that we cannot discover any other way. This is especially true for rate of draw force changes. It is hard to see these rate changes when looking at the draw force numbers in the table and it is impossible to quantify them when drawing bows by hand. When we pull a bow, yes, we can feel that the rate of draw force change is increasing or decreasing, and if it is happening early in the draw, in the middle of the draw, or late in the draw, but when we look at the FDC, we can see where and how much has occurred. Plus, we can be more objective when comparing bows.
What makes the smoothest drawing bow?
The rate of draw force change in the draw stroke determines whether a bow feels “smooth”. We know that the hardest pulling bow will always have the FDC with the steepest slope which represents the most increase in draw force, whereas the easiest pulling bow will always have the least sloping FDC which represents less draw force increase. Compare that with what creates the roughest vs. smoothest pulling bow. The roughest pulling bow will always have the tightest changing curves, and the smoothest pulling bow will always have the most gradual changing curves.
Don’t confuse “smoothest” and “easiest.” Hard pulling, high energy storing bows can be very smooth. In order to be high energy storing and very smooth, a bow must have very gradual curves in the FDC. The highest performing and smoothest traditional bow must usually be able to store a lot of energy throughout the latter inches of the draw. This can be hard to accomplish in a bow design without creating stack. A stacking bow does store a lot of energy but it is not pleasant to pull. The key is to design your traditional bow so it won’t stack until after full draw is reached. This also moves the valley or sweet spot farther to the right on the FDC and allows the bow to store additional energy in the latter inches of the draw.
Different styles of bows have different force draw curves
It shouldn’t be a surprise that different bow styles (straight bow, reflex/deflex bow, recurve bow, and compound bow) typically have different-looking force draw curves. I gathered several bows out of my closet, including a red oak board bow, a reflex/deflex hybrid longbow, an old Super Kodiak recurve, and some data from a typical compound bow, and created FDCs of each of them to illustrate how they differ.
Straight bow
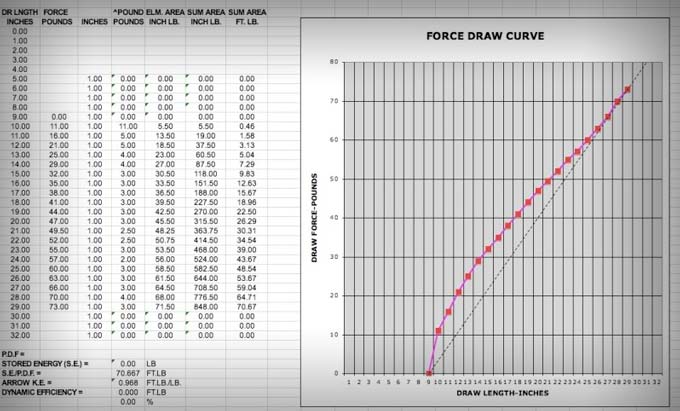
The FDC below is the red oak board bow. This is a 66” nock-to-nock bow that I made from a red oak board that I bought at the local home improvement store. It has tip extensions and buffalo horn tip overlays that flip the tips into about one inch of reflex in the outer six inches of the tips. Other than the outer tips, this bow has a perfectly straight back profile. It is an equal thickness bow from the fadeouts to the tips and has a pyramid/straight width taper also from the fades to the tips. As you can see from the table, it developed 40#@28”. The peak draw force was 40#, SE was 34.92 ft/lb, and SE/PDF was 0.873 ft lb/lb.


Look at the straight line this FDC makes! Whoa, did you ever think a FDC could be any straighter? This bow gained almost exactly two pounds per inch all of the way from brace height to full draw. The curve looks like it doesn’t diverge from the straight reference line clear out past the 28” full draw length—the bow does not stack—but it doesn’t have a big increase in stored energy early in the draw, either. The best-fit curve drawn by Excel makes it look like a stacking trend is just starting to develop after 28”, but if you look at the “change per inch” column in the table, you can see that some stacking has possibly already started between 24” and 25” of draw. I certainly can’t feel that in the bow when I draw it by hand. My readings were a bit scattered in this area of the draw which might be skewing things a bit, but the best fit curve seems to confirm it as well. With such an almost perfectly straight line for a FDC, we know that this bow is gaining draw force at a fixed rate of increase, and by looking at the table we can see it is a fixed rate of two pounds per inch. This was an interesting discovery.
In the hand shooting session, this bow shoots pretty fine, but it just keeps getting harder to pull all of the way to full draw…just what you would expect for a fixed rate of draw force increase. It casts an arrow just fine, but doesn’t have any “flip” or “snap” during the power stroke like a r/d bow or recurve. I have to say that this bow is deadly quiet. It makes almost no sound when the arrow leaves the bow.
Reflex/deflex longbow
The next FDC shown below is the same osage HAMMER Hybrid Longbow that I collected data from in the other posts of this series. This is a 64”, reflex/deflex, fiberglass composite, hybrid longbow with actionboo positive tapered core laminations, power lams at the riser, tip wedges, and phenolic tip overlays. The osage orange riser is 18”. The bow has about 3-1/2” of reflex and 1-1/2” of deflex, combining for a net reflex of about 2”. As you can see from the table, it developed 35#@28”. The peak draw force was 35#, SE was 32.46 ft/lb, and SE/PDF was 0.927 ft lb/lb.


Unlike the straight bow, this FDC has more of an “S” curve that is typical of most traditional bows with reflex in the limbs or recurved tips. The reflexed tips cause the bow to store more energy early in the draw than a straight bow. You can see that by the hump on the left portion of the FDC. The rate of draw force change is very gradual over the entire curve, which gives the bow a very smooth draw. The curve just starts diverging upward from the reference line at about 27” which would indicate a slight onset of stacking at that draw length. Looking the numbers in the change per inch column in the table, I can see that stacking actually starts between 26” and 27”, but it is a slight and gradual increase. I cannot feel it during the draw at my 28” draw length. This tells me that this bow is probably good for draw lengths out to 28” or 29”, but for longer draws, I would make a 66” bow.
This is my bow design, so I admit that I am biased, but this bow draws very smoothly. The sweet spot is located nicely right before full draw and you can really feel it in the outer inches of the draw as the tips roll over and straighten out. This bow has a nice “snap” to it as the arrow is launched. I am sure this is due to the higher stored energy early in the draw. This bow is not very noisy, but like most fiberglass composite bows, it is louder than the red oak board bow and makes more of a “ping” during the shot than the wood bow’s soft “thump.”
Recurve bow
The next FDC below is an old Bear Super Kodiak one-piece recurve. It is a 60”, fiberglass composite recurve with maple hardwood core laminations (I assume) and fiberglass tip overlays. I didn’t measure the geometry on this bow, but I think it represents a pretty common recurve design that most traditional archers are familiar with. As you can see from the table, it developed 39#@28”. The peak draw force was 39#, SE was 33.63 ft/lb, and SE/PDF was .862 ft lb/lb.


The next FDC below is the same Bear Super Kodiak, but I went ahead and drew it on out to 32” so you can see where and how much it stacks by looking at the actual data.

The FDC of the Super Kodiak looks pretty typical of a bow with recurved limb tips. The FDC is steeper in the early inches of the draw than the straight longbow or the reflex/deflex longbow. The FDC doesn’t look like it is diverging up and away from the straight reference line until about 29”, but the data in the table doesn’t confirm that as it shows that some stacking is starting to occur between 25” and 26”. Even though the FDC doesn’t show too much stacking at my 28” draw length, this bow feels like it has opened up and at the limit when I draw it by hand.
I have to admit that I don’t really like drawing or shooting this bow very much. Sorry Fred and all of the dedicated Bear shooters reading this, but this bow really seems like a dog to me. It does have a bit more “snap” to it than the red oak board bow (like you would expect with it’s early energy storage), but the cast seems pretty slow, very noisy, and it vibrates a lot after the shot. This bow doesn’t “thump” or “ping,” it just goes “thwack!”…then vibrates. It seems to be out of balance for a split finger style shooter and the tips seem pretty heavy. I’m pretty sure that I could narrow the tips and sand the glass a bit to make it more balanced and reduce the shock, but with a draw weight already at 38#@28” there isn’t any room to make adjustments. 🙁
Compound bow
The next FDC below is of a typical compound bow with two energy wheels or “cams”. This bow represents a pretty common compound bow design. As you can see from the table, it had a holding force of 13#@29”. The peak draw force was 46#. I won’t report the SE and SE/PDF since the draw length was longer than the other test bows.

The FDC of the compound bow is typical for compound bows with energy wheels. The curve rises rapidly from brace height with an initial “front slope,” a “peak dwell” portion at the top, a “let off” portion as the draw force decreases into the “valley” at the bottom of the curve at full draw, then a “wall” where the draw force increases very steeply after the valley. Obviously, the “wall” is where a compound bow stacks. This is illustrated dramatically in the FDC where the curve diverges almost vertically up and away from the straight reference line. It is pretty easy to see from the way the FDC is curving that the draw force is increasing at an increasing rate at the wall. This FDC has very gradual transitions for a compound bow leading us to believe that this bow would draw very smoothly compared to compounds with more radical cams and more rectangular FDCs.
As you can see, because of the leverage advantage of the compounding system, a compound bow can store much more energy than a traditional bow with either straight, reflexed, or recurved limbs.
The FDC of a high performance compound bow with radical cams approaches what we would consider as the highest energy storing FDC possible, which would have the shape of a rectangle. In the perfect FDC model, the draw force would increase in a straight line up to peak draw force, then continue to store that amount of energy all of the way to full draw…not too different than the FDC of a compound bow with radical cams!
Summary
WOW…we’ve covered a lot of material in this series of posts! In part one, we discussed building our bow weighing rack and measuring the draw weights of our bow at each one inch increment of the draw. Then, in part two, we entered the data into a table in the spreadsheet template that I created for Microsoft Excel, and we got to watch Excel automatically create the FDC scatter graph showing the force/draw curve. We discussed the values that Excel created for our bow including stored energy and efficiency. And finally, in this last post, we learned how to read the force draw curve and looked at the force draw curves of several different types of bows. Hopefully, you enjoyed learning how the slope of the curve affects perceived effort during the draw and how the shape of the curve describes the rate of draw force change.
I hope you will download the spreadsheet template and try it out for yourself. I REALLY encourage you to make a force draw curve for every bow that you build! You will learn so much more about your bow, including how and where it is able to store energy, and at what draw length it stacks. The force draw curve gives documented proof of what is really happening during the draw stroke of your bow, whereas just pulling your bows by hand gives you a subjective opinion at best. Making a force draw curve for every bow design that you make is a bit more work than not making one, but as you are able to compare your bows over time I think you’ll find it is worth the effort.
Click the links below to see the other posts of this series:
Part 1: How to set up a bow weighing rack.
Part 2: How to MAKE a force/draw curve.
Click “Like” below to share this post with your friends, and please feel free to leave a comment or ask a question.
Related Posts
Comments (0)